In today’s fast-paced software landscape, ensuring optimal reliability and performance is more critical than ever. As applications grow in complexity—spanning microservices, multi-cloud environments, and real-time data streams—traditional monitoring falls short. Enter AI-driven observability, a transformative approach that combines advanced telemetry collection with machine learning to deliver end-to-end insights and proactive issue resolution. In this guide, we’ll explore the principles, tools, and best practices you need to implement AI-powered observability in 2024 and beyond.
Why Observability Matters More than Monitoring
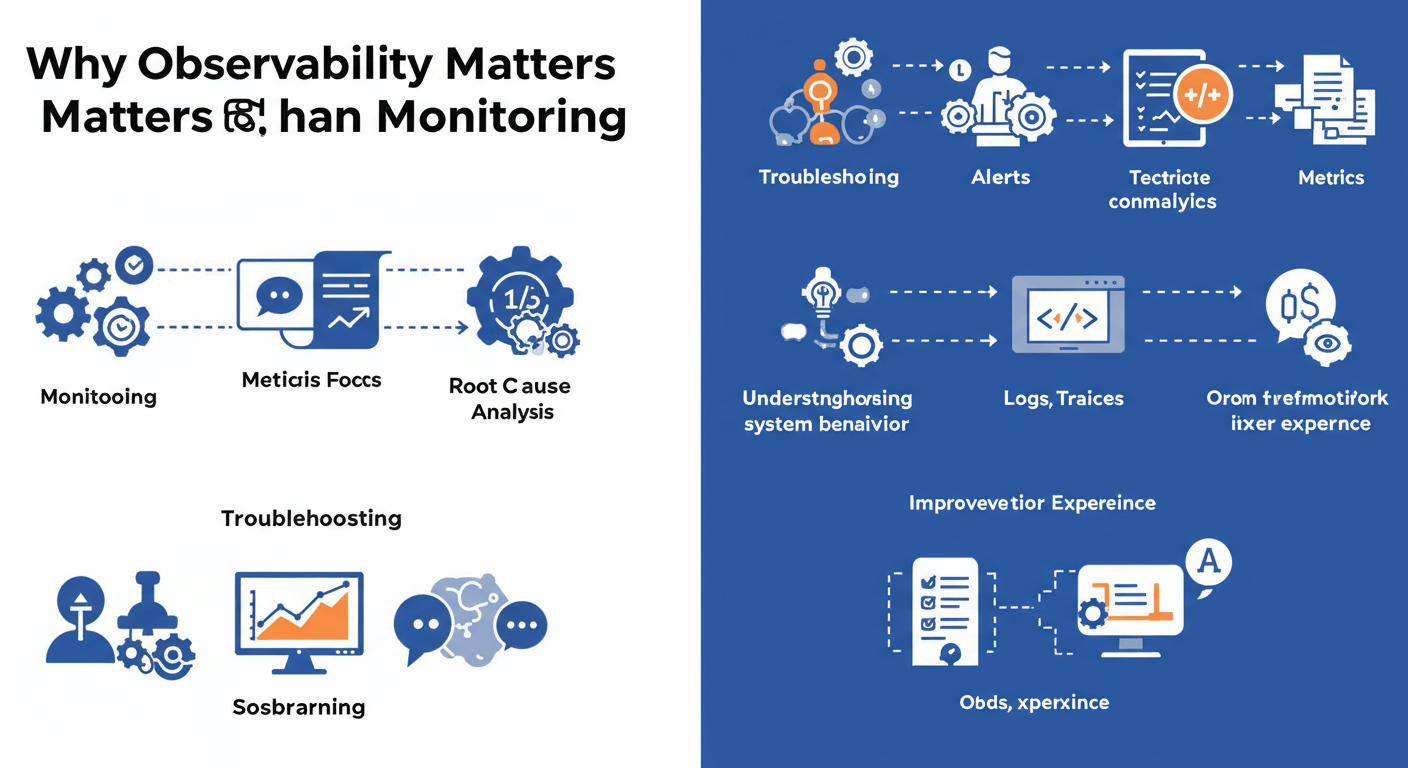
Conventional monitoring solutions typically track predefined metrics and raise alerts when thresholds are breached. While useful, this approach is inherently reactive and lacks context when diagnosing complex failures. Observability goes deeper by collecting granular telemetry—logs, metrics, traces, and events—and correlating them to provide a holistic view of system behaviour. By adding AI to the mix, you enable:
- Anomaly Detection: Machine learning models identify deviations from normal patterns with minimal manual configuration.
- Root-Cause Analysis: AI algorithms correlate multi-dimensional data to pinpoint underlying causes of performance degradation.
- Predictive Insights: Forecasting models anticipate resource constraints or failure points before they impact users.
- Reduced Alert Fatigue: Smart filtering and clustering group-related alerts, lowering noise and speeding up response.
Core Components of AI-Driven Observability
Implementing AI-driven observability involves integrating several core components into your DevOps lifecycle:
1. Unified Telemetry Ingestion
Collect logs, metrics, traces, and events from every layer of your stack—application code, middleware, infrastructure, and user interactions. Use open standards like OpenTelemetry to instrument services consistently and export data to a centralized observability platform.
2. High-Throughput Storage and Processing
Telemetry data can balloon to terabytes per day. Leverage scalable time-series databases, object storage, and real-time stream processing engines (e.g., Apache Kafka, Elasticsearch) to ingest and index data without latency spikes.
3. AI and ML Analytics Layer
Apply machine learning models—unsupervised clustering for anomaly detection, supervised classifiers for event categorization, and time-series forecasting for capacity planning. Many observability platforms now include pre-built AI modules that can be customized to your environment.
4. Contextual Visualization and Dashboards
Interactive dashboards should combine metrics, traces, and logs in a single view. AI-driven insights—highlighted anomalies, suggested alerts, and predictive charts—help teams quickly focus on critical issues.
5. Automated Alerting and Remediation
Integrate alert workflows with incident management tools. AI can suggest remediation playbooks or even trigger automated rollbacks, container restarts, or auto-scaling actions when thresholds are crossed or anomalies detected.
Implementing AI-Driven Observability: Step by Step
Transitioning from traditional monitoring to AI-powered observability can be streamlined into five phases:
- Assessment and Goal SettingDefine key objectives: reduce MTTD (Mean Time to Detect), improve SLA adherence, or optimize resource usage. Audit existing telemetry sources and identify gaps.
- Telemetry InstrumentationInstrument application code with OpenTelemetry SDKs. Enable distributed tracing, custom metric emission, and structured logging for better context.
- Platform Selection and DeploymentEvaluate observability platforms offering built-in AI analytics: Datadog, Dynatrace, New Relic, Grafana Cloud, or open-source alternatives with AI plugins. Deploy agents or sidecars to gather data in real time.
- Model Training and TuningLeverage historical telemetry to train anomaly detection and forecasting models. Continuously retrain with new data to adapt to changing application behavior.
- Feedback Loop and IterationEstablish a feedback process between SRE, DevOps, and development teams. Use post-incident reviews to refine alert thresholds, update model parameters, and enhance dashboard layouts.
Best Practices for Maximum Impact
- Adopt Open Standards: Use OpenTelemetry and Prometheus exporters for vendor-agnostic instrumentation.
- Data Hygiene: Prune noisy logs, normalize metric names, and tag telemetry with metadata (service name, environment, region).
- Balanced Alerting: Combine static thresholds with AI-driven anomaly signals to minimize false positives.
- Cross-Team Collaboration: Integrate observability insights into daily standups and sprint retrospectives to foster a culture of continuous improvement.
- Cost Optimization: Archive or sample low-value telemetry. Use tiered storage for older data while keeping hot data readily accessible for AI analysis.
Real-World Example: Scaling a Microservices Platform
Imagine a fintech startup running a Kubernetes-based trading application. As transaction volumes surge, intermittent latencies frustrate users. By implementing AI-driven observability, the team achieved:
- 30% reduction in incident response time by automatically correlating slow traces with deployment events.
- Predictive scaling alerts that spun up additional pods 15 minutes before peak loads, maintaining sub-100ms response times.
- 75% fewer redundant alerts through anomaly clustering, freeing engineers to focus on feature development.
Challenges and How to Overcome Them
Transitioning to AI-driven observability isn’t without hurdles:
- Data Overload
- Mitigate by sampling, aggregation, and setting retention policies. Prioritize high-cardinality attributes for AI models.
- Model Drift
- Continuously retrain on fresh data and implement validation pipelines to detect reduced accuracy.
- Organizational Buy-In
- Demonstrate quick wins with pilot projects. Highlight time saved and reliability gains to secure broader investment.
Future Trends in Observability
Looking ahead, expect to see:
- AI-Augmented ChatOps: Conversational interfaces for querying telemetry and executing remediation commands.
- Edge Observability: Distributed tracing and anomaly detection closer to IoT and edge devices.
- Unified Security and Performance Observability: Correlating security events with performance telemetry for holistic risk management
Frequently Asked Questions
1. What’s the difference between monitoring and observability?
Monitoring collects predefined metrics and logs, while observability gathers all telemetry—metrics, logs, traces—and uses that data to infer the internal state of a system.
2. Do I need a dedicated AI team to implement observability?
Not necessarily. Many platforms provide built-in AI modules. Focus your efforts on data instrumentation, and leverage vendor tools for analytics and alerting.
3. How much does AI-driven observability cost?
Costs vary based on data volume, retention policies, and feature tiers. Start with a pilot on critical services and scale observability coverage over time to manage costs effectively.
Ready to elevate your software reliability? Begin your AI-driven observability journey today and experience the future of proactive, intelligent operations.
Conclusion
AI-driven observability represents the next evolution in achieving rock-solid software reliability. By unifying rich telemetry, advanced machine learning, and automated workflows, teams can detect anomalies faster, resolve incidents with precision, and continuously optimize performance. As you embark on your observability journey in 2025, remember to start small, iterate quickly, and foster collaboration across DevOps, SRE, and development teams. The payoff is a resilient, high-performing application that delights users and stays ahead of the competition.

